Pesticide residue detector
Veterinary drug residue detector
Food safety detector
Food additive detector
Bacterial and microbiological detector
Food pre-treatment integrated machine
Soil and fertilizer nutrient detector
Plant Physiology Detector
Water quality detector
Meteorological monitoring station


model:YT-G20
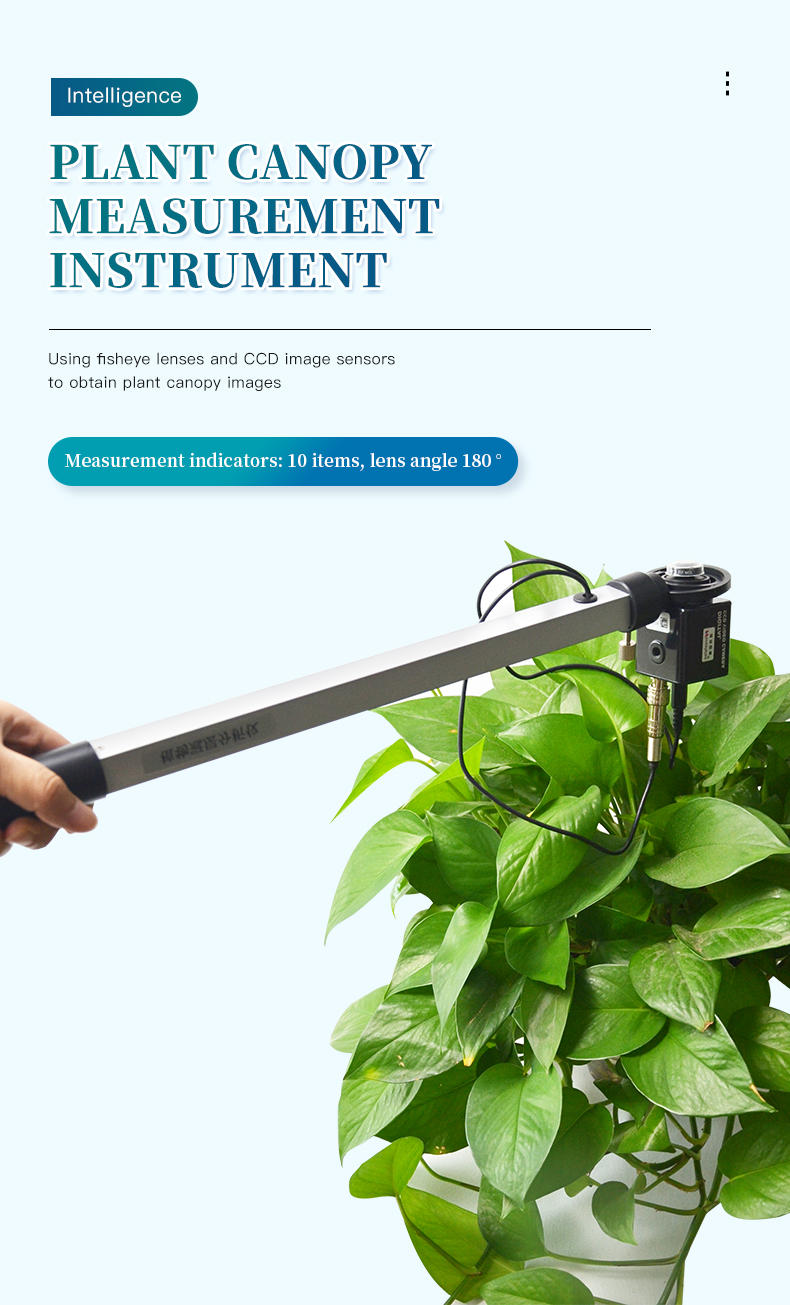
Instrument IntroductionThe plant canopy image analyzer is used for the study of plant canopies at various heights. Fisheye lenses and CCD image sensors are used to obtain plant can···
 technical support
Yuntang Technology
One click access to quotation WeChat Scan Code Add Technical EngineerWhatsApp:+86 18866361895
WeChat:+86 17865361250
Email:yuntang@foxmail.com
closeDetails
Picture and Text Introduction
Related Cases
Instrument Introduction
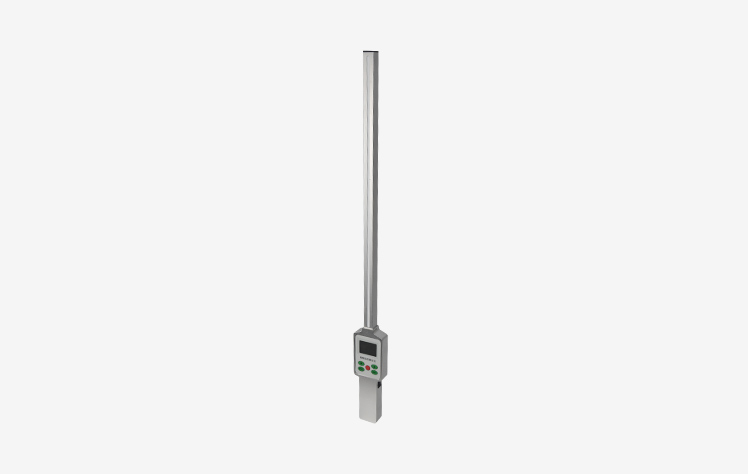
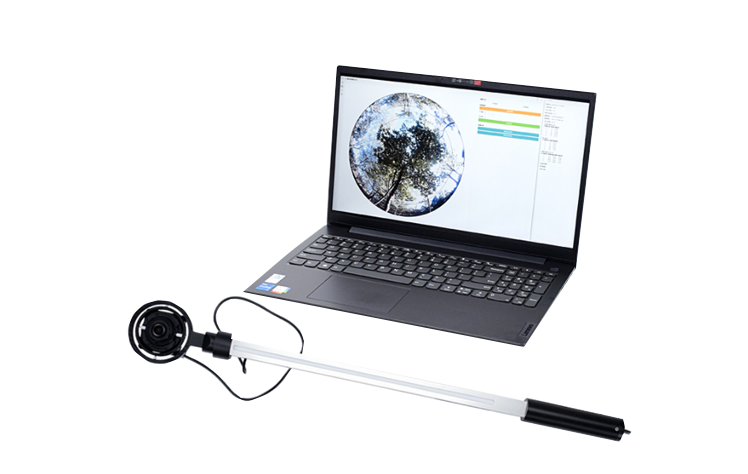
The plant canopy image analyzer is used for the study of plant canopies at various heights. Fisheye lenses and CCD image sensors are used to obtain plant canopy images, and specialized analysis software is used to obtain relevant indicators and parameters of the plant canopy. By using fisheye lens imaging to measure plant canopy data, only one operation is required, simplifying the complex work of traditional measurement methods that require multiple measurements at fixed points per day. Moreover, using image method to measure canopy can actively avoid canopy gaps that do not comply with the calculated canopy structure parameters, as well as obstacles that do not comply with measurement calculations.
Testing principles and methods
The plant canopy image analyzer adopts the principle of correlation between canopy porosity and canopy structure. It is based on the Beer's law of attenuation of light passing through a medium, and defines a series of assumptions for the plant canopy. Using a semi theoretical and semi empirical formula, the canopy structure parameters are calculated by measuring the canopy porosity. This is the principle unanimously adopted by various canopy instruments around the world. Under the above principle, the plant canopy image analyzer adopts the method of analyzing and measuring the canopy porosity of the hemisphere image under the canopy, which is the most accurate, labor-saving, time-saving, and convenient method among various methods.
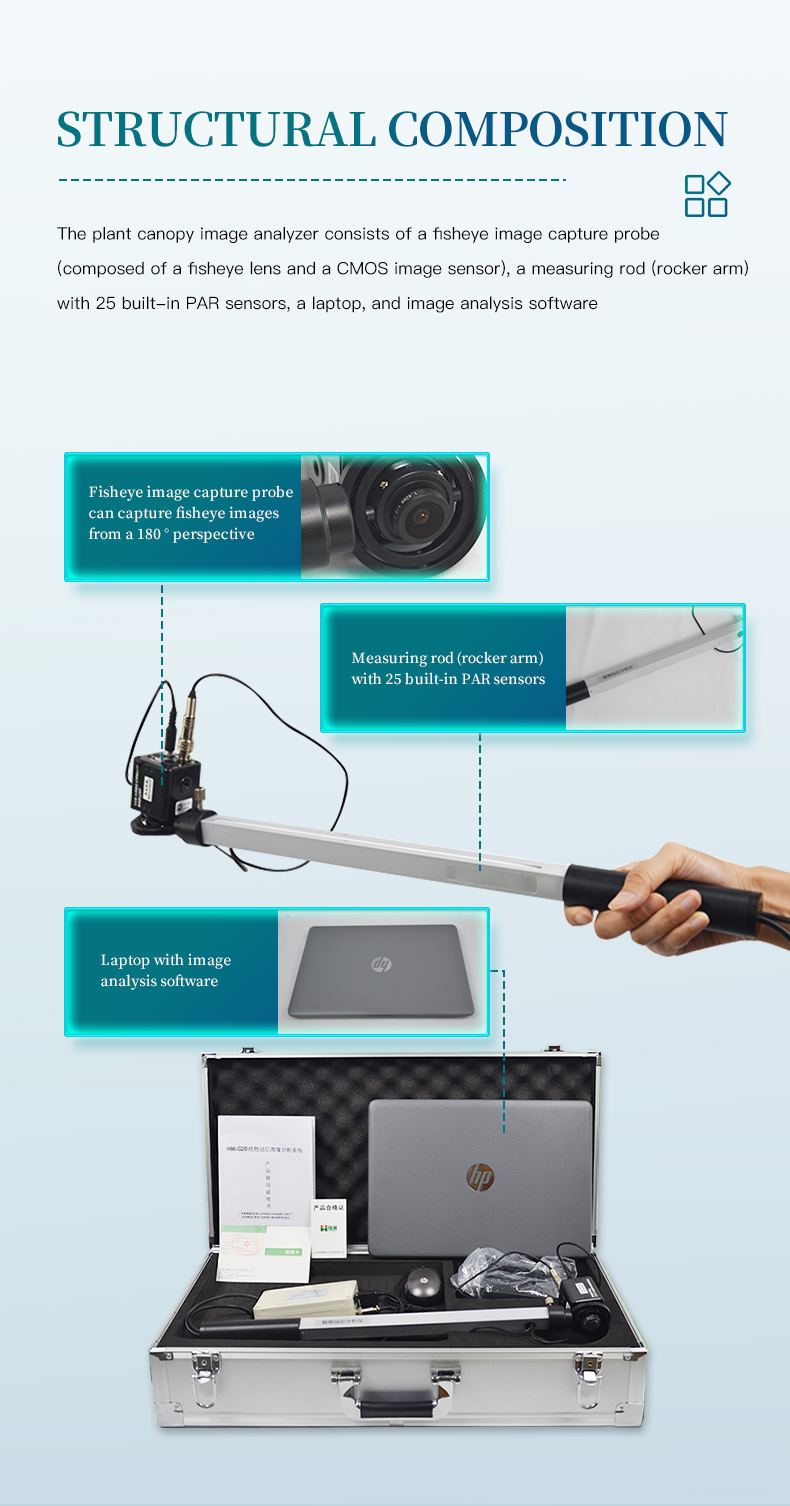
Structural composition
The plant canopy image analyzer consists of a fisheye image capture probe (composed of a fisheye lens and a CCD image sensor), a measuring rod (rocker arm) with 25 built-in PAR sensors, a laptop, image acquisition software, and image analysis software. The fisheye probe is installed at the top of a lightweight rocker arm and can capture fisheye images from a 150 ° angle of view. The display and storage of images are completed by the configured laptop computer.
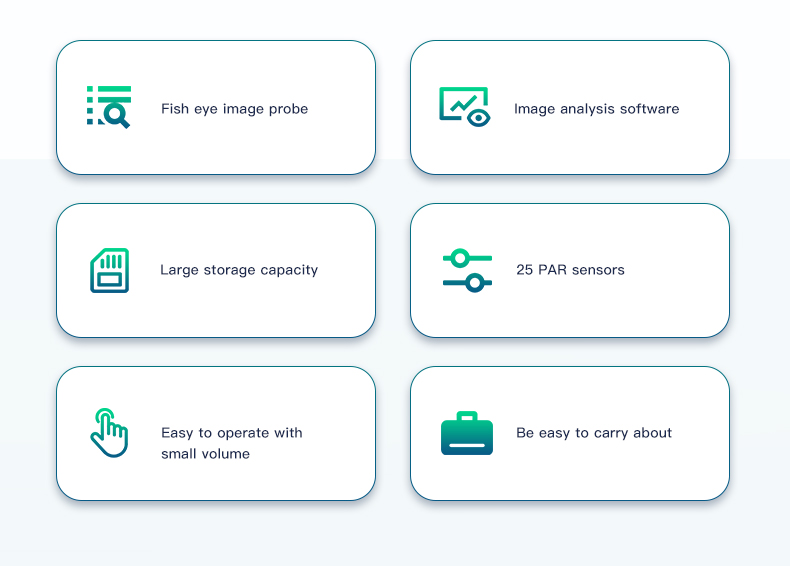
Functional Features
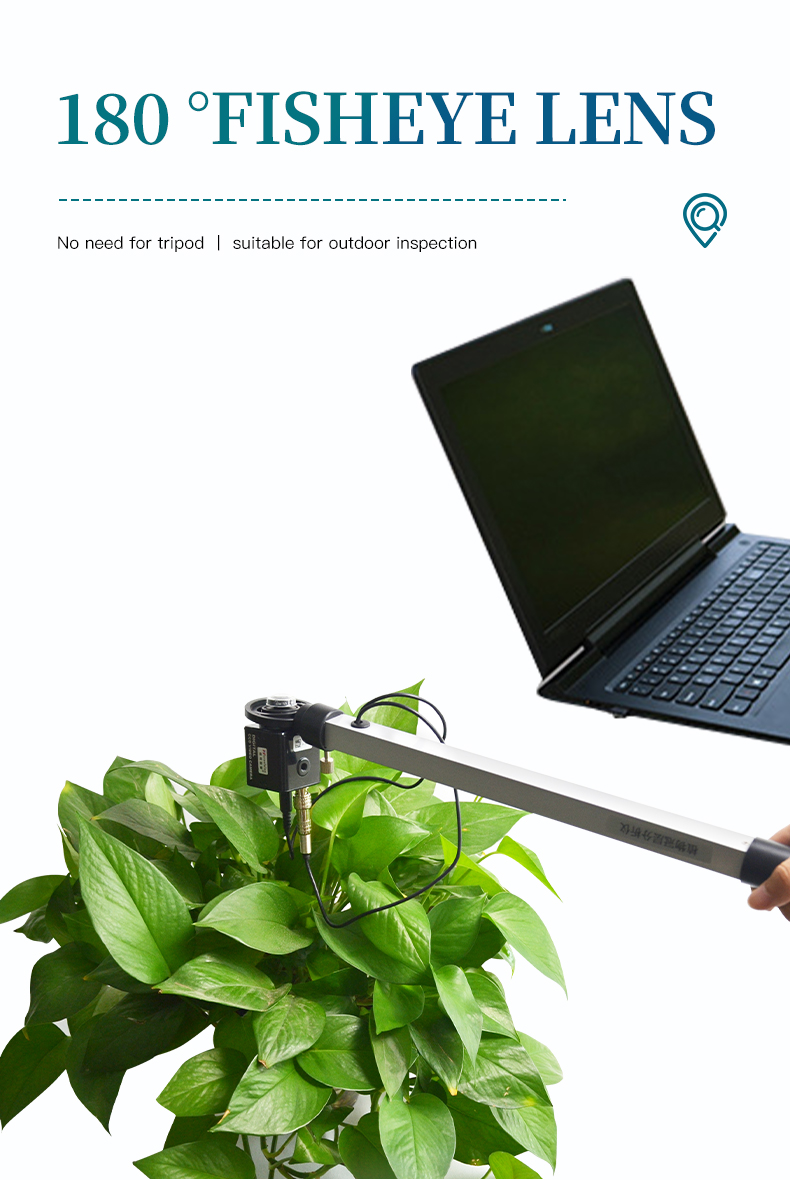
Fish eye lens can automatically maintain a horizontal state: a small fish eye camera lens specially designed for measuring plant canopy structure is installed on a handheld universal balance joint, which can automatically maintain the lens in a horizontal state without the need for a tripod;
Fisheye lenses can be extended into the canopy: the lens is installed at one end of the rocker arm, and due to its small size and measuring rod, it can be easily extended horizontally or vertically to different heights of the canopy for rapid layered measurement, measuring the vertical distribution of light transmittance and leaf area index within the population;
Image analysis software: Image analysis software can define any image analysis area (zenith angle can be divided into 10 zones, azimuth angle can be divided into 10 zones).
Can block unreasonable canopy parts: When conducting regional analysis of canopies in different directions, it is possible to arbitrarily block ground features and unreasonable canopy parts (such as missing plants, edge row problems, etc.). The selection of starting and ending angles for different zenith angles can avoid canopy pore conditions that do not comply with the calculation of canopy structure parameters. By manually adjusting the threshold, parameters such as leaf area index can be measured more accurately;
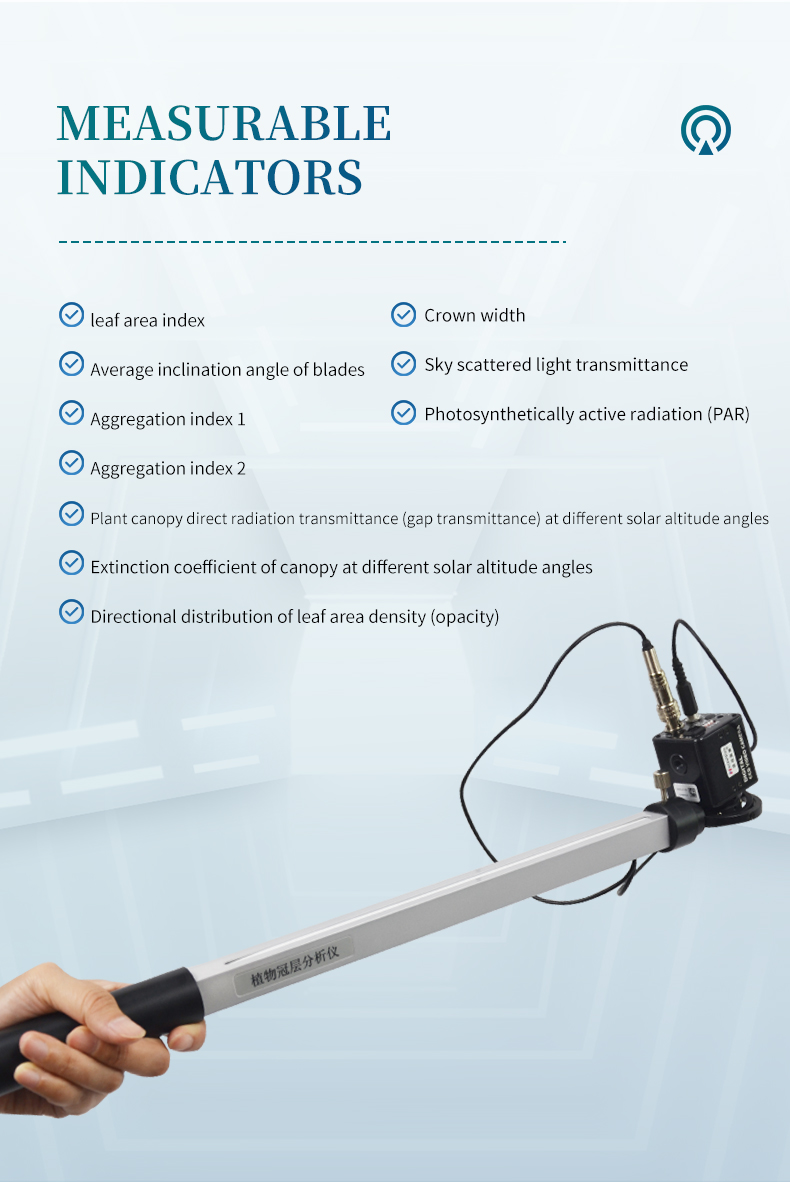
Measurable indicators
Leaf area index
Average inclination angle of blades
Sky scattered light transmittance
Plant canopy direct radiation transmittance at different solar altitude angles
Extinction coefficient of canopy at different solar altitude angles
Directional distribution of leaf area density
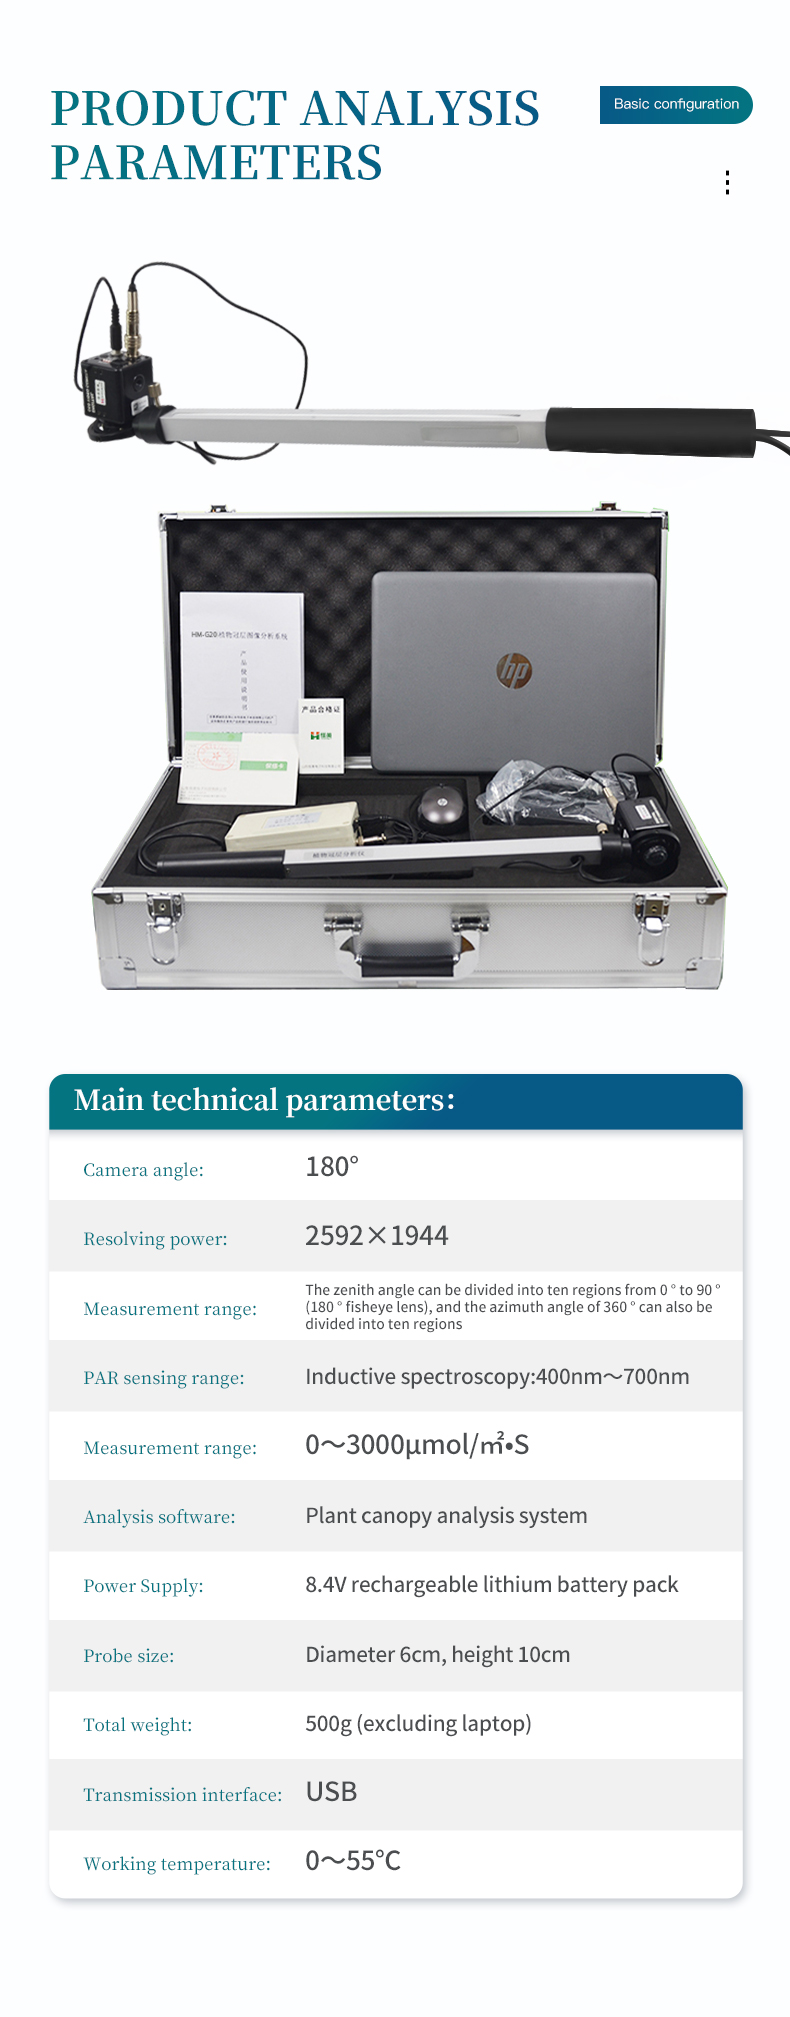
Main technical parameters of the instrument
Camera angle: 150 °
Resolution: 768 × 494
Measurement range: The zenith angle can be divided into ten regions from 0 ° to 75 ° (150 ° fisheye lens), and the azimuth angle of 360 ° can also be divided into ten regions
PAR sensing range: sensing spectrum from 400nm to 700nm
Measurement range: 0-2000 μ mol/㎡• S
Real time display of GPS satellite positioning latitude and longitude, clarifying the current detection location
The test results can be directly transmitted to a dedicated cloud agriculture data center, equipped with a dedicated cloud agriculture data center account
Analysis software: Plant canopy analysis system
Probe size: diameter 6cm, height 10cm
Total weight: 500 grams (excluding laptop)
Transmission interface: USB
Working temperature: 0-55 ℃
WeChat:+86 17865361250
WhatsApp:+86 18866361895
Email:yuntangzhineng@foxmail.com
Copyright @ 2019-2022 Shandong Yuntang Intelligent Technology Co., Ltd All Rights Reserved. Copyright Source manufacturer of pesticide residue detector, food detector, bacteria detector
 WeChat


TOP
 Leave us a message